How to monitor generative AI calls to AWS Bedrock
Aug 27, 2024
Tracking your AWS Bedrock usage, costs, and latency is crucial to understanding how your users are interacting with your AI and LLM powered features. In this tutorial, we show you how to monitor important metrics such as:
- Generation count
- Average cost per API call
- Average cost per user
- Average API response time
- Error rate
We set up a basic Next.js app, implement the Bedrock API, and capture these events using PostHog.
While this tutorial focuses on Next.js and Node, PostHog supports many different SDKs and frameworks. The concepts in this tutorial apply to all our supported SDKs and frameworks.
1. Download the sample app
We've created a basic recipe builder app for this tutorial. You can download it from Github.
To set your app up, first ensure Node is install. Then run npm install to install all dependencies.
You must also ensure that you have properly configured your AWS credentials and region to use the AWS SDK for JavaScript. You can do this by calling aws configure using the AWS CLI.
Once done, update the BedrockRuntimeClient initializer in src/app/api/generate-recipe/route.js to use your preferred AWS region:
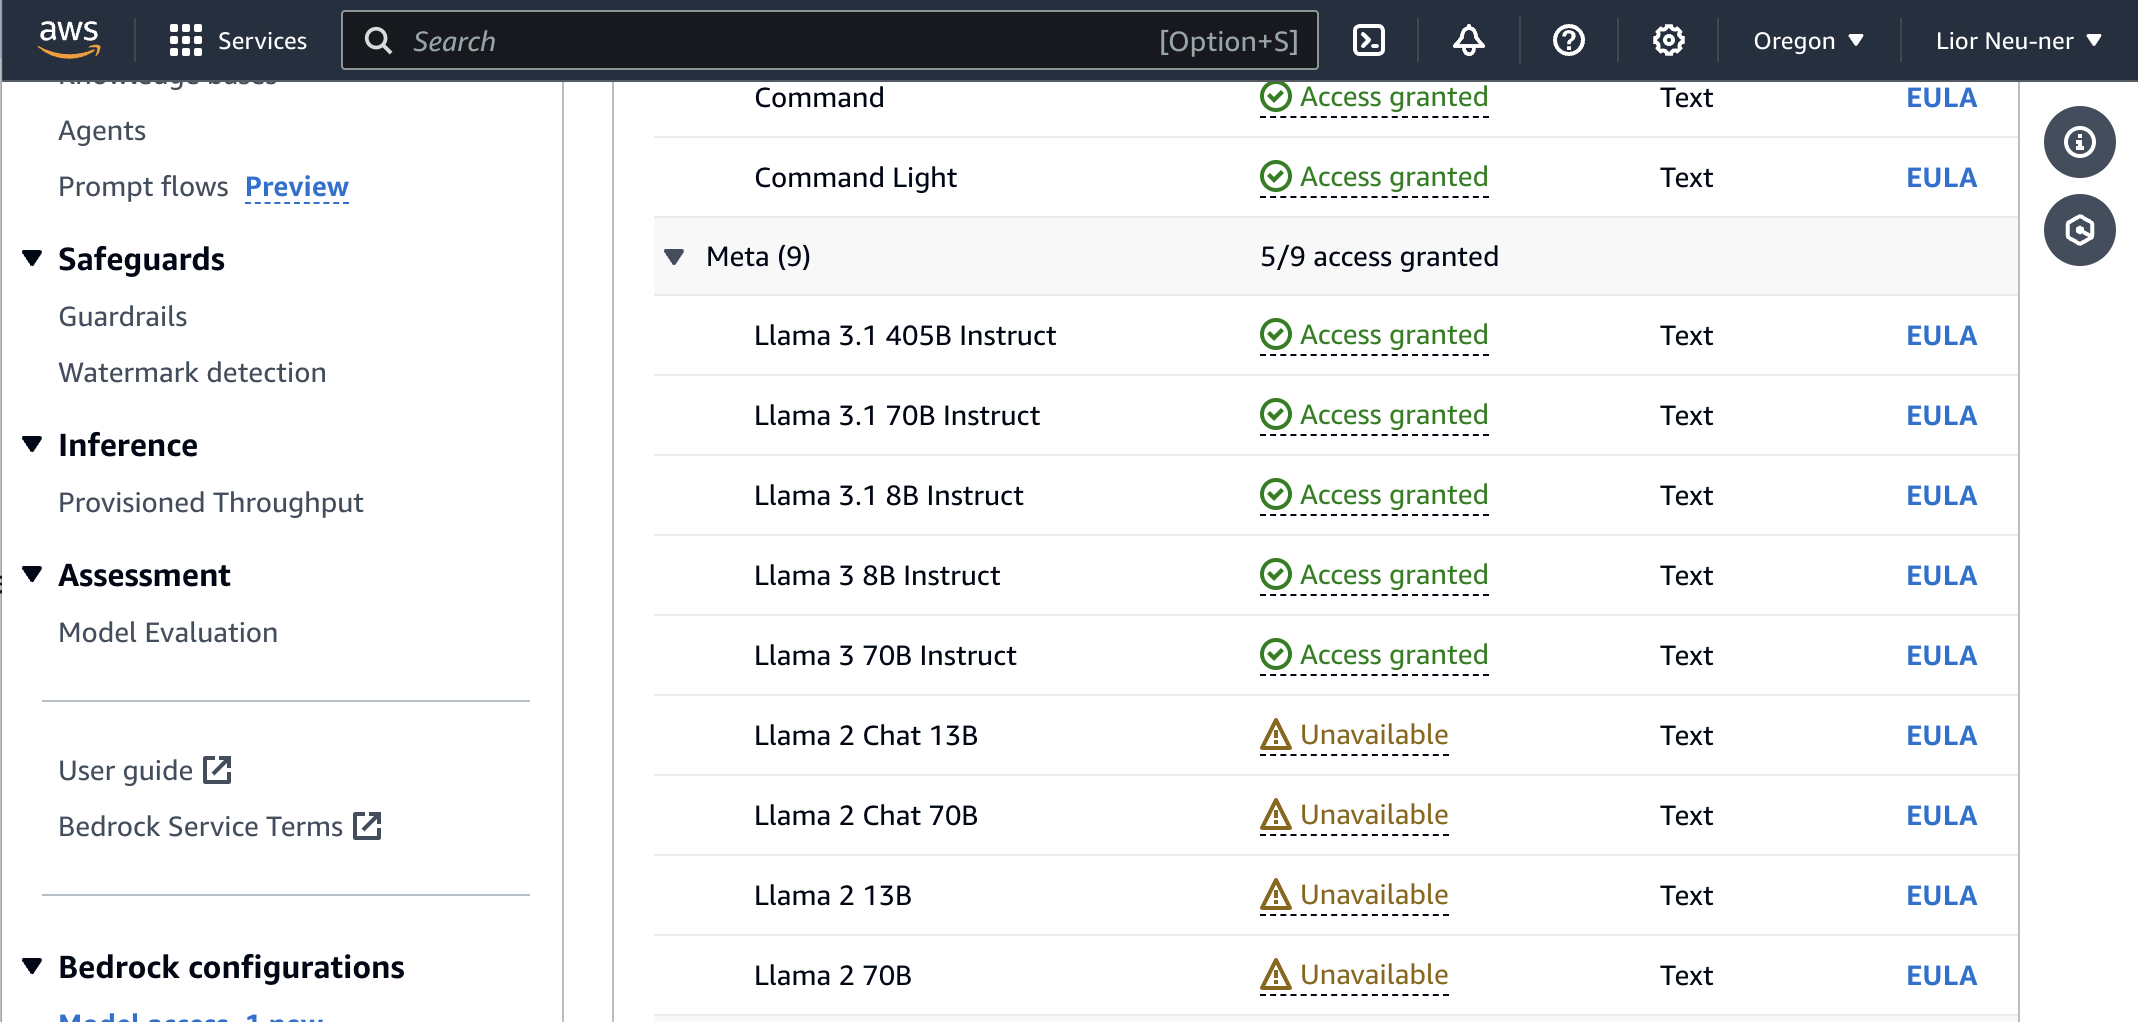
You'll also notice that we're using Meta's Llama 3.1 8B Instruct model. Make sure you have access to this model, or request access if you don't (you may need to change regions in AWS if it's not available. Alternatively, you can use a different LLama model).
Note that while this tutorial uses the Llama model, the concepts in this tutorial apply to all of Bedrock's supported models.
Run npm run dev and go to http://localhost:3000 to everything in action.
2. Add PostHog to your app
With our app set up, it’s time to install and set up PostHog. To do this, we install the PostHog Node SDK to capture events in our API route by running the following command in our terminal:
Next, we initialize PostHog using our API key and host (you can find these in your project settings). We also call posthog.shutdown() in a finally block to send any pending events before the serverless function shuts down. Add the below code to src/app/api/generate-recipe/route.js:
3. Capture events
With our app set up, we can begin capturing events with PostHog.
Successful requests
To start, we capture a bedrock_completion event with properties related to the API request like:
promptgenerationprompt_token_countgeneration_token_count
To do this, add a posthog.capture() call after receiving a response from Bedrock:
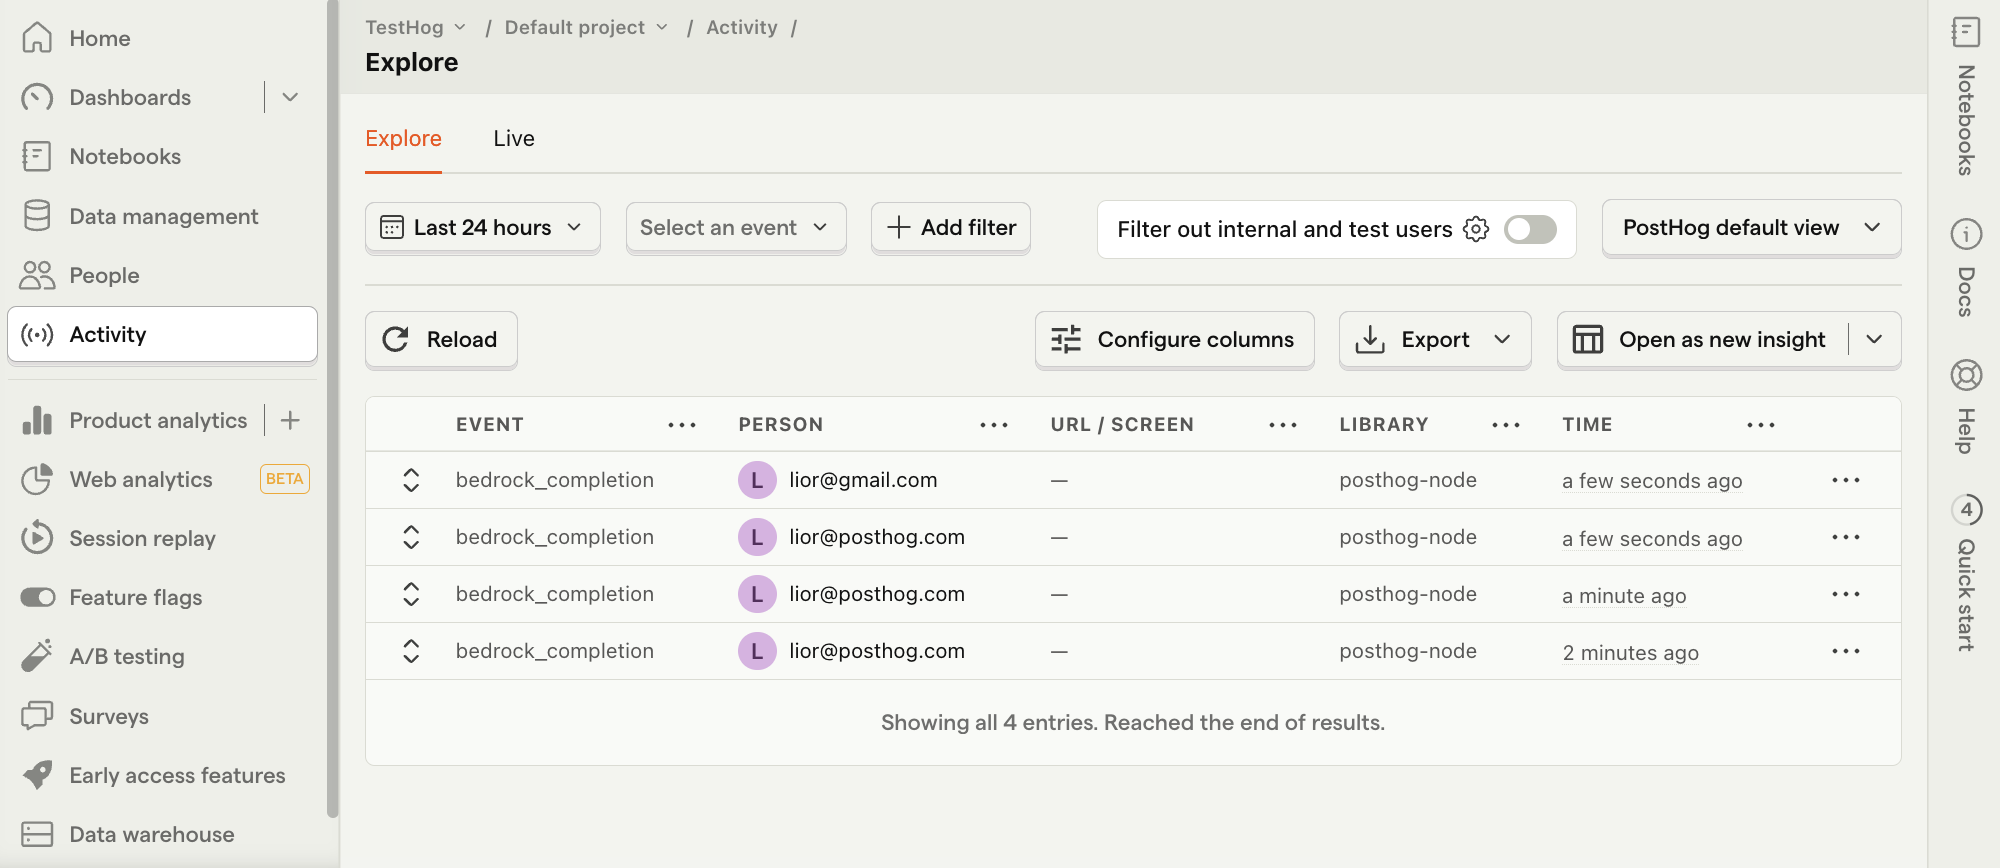
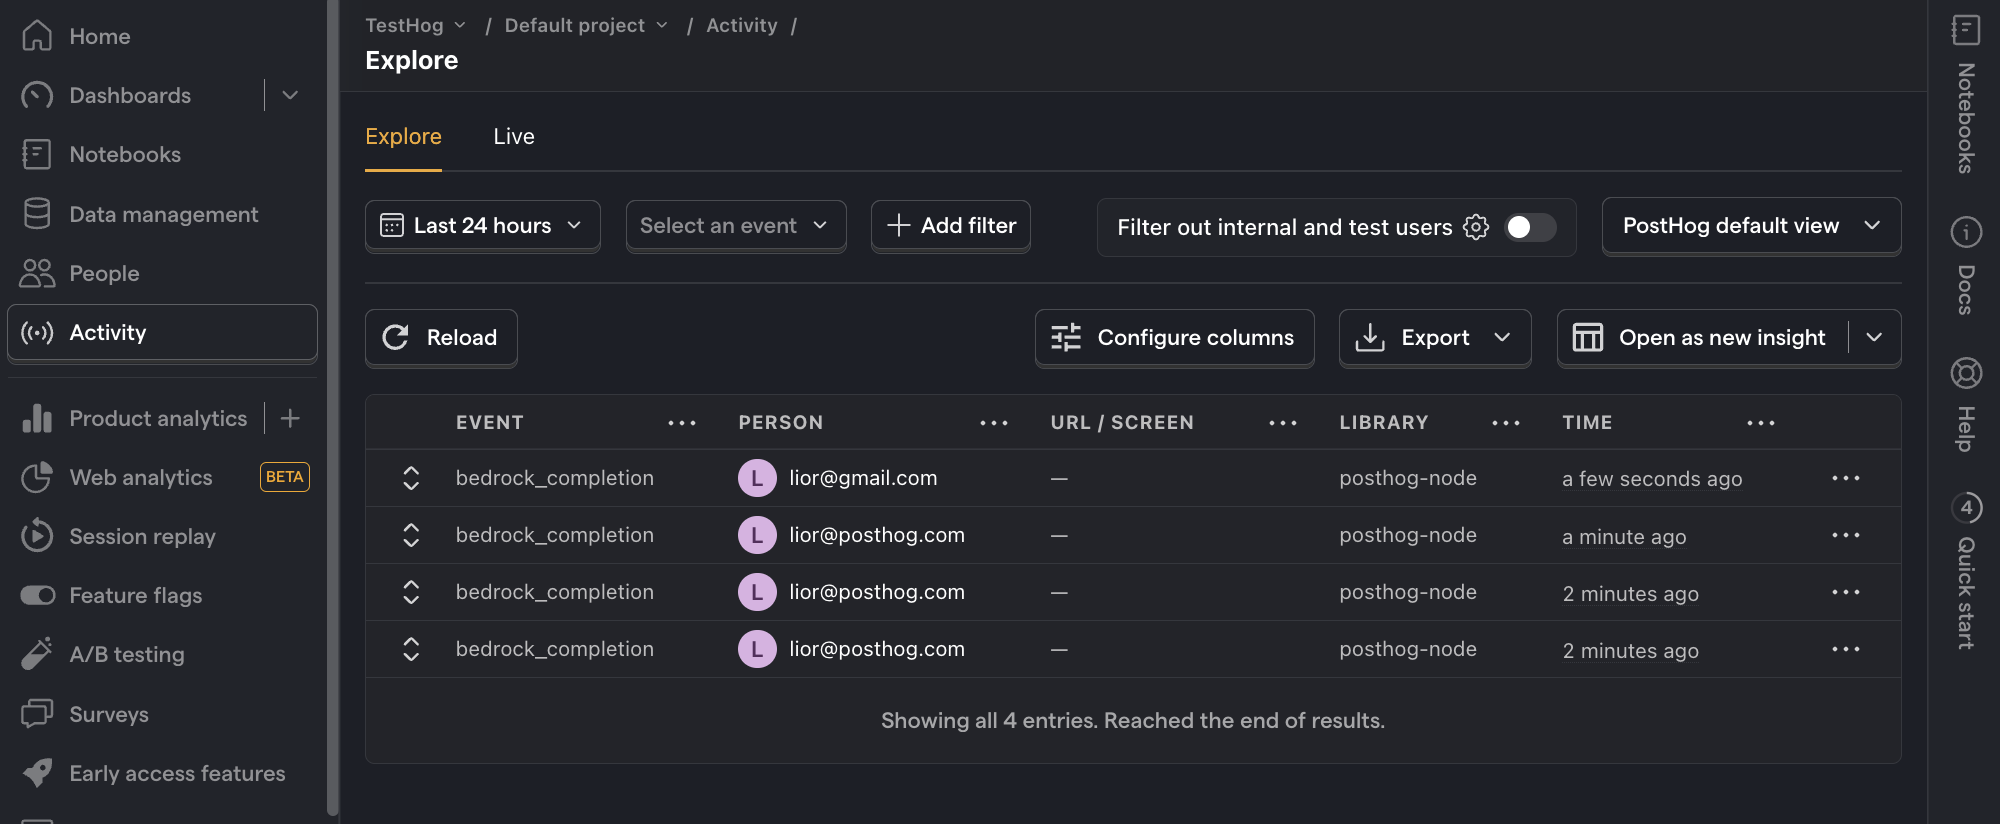
Refresh your app and submit a few prompts. You should then see your events captured in the PostHog activity tab.
Costs
To keep track of your generative AI costs, you can include additional properties to your event capture, namely:
input_cost_in_dollarsi.e.prompt_token_count*token_input_costoutput_cost_in_dollarsi.e.generation_token_count*token_output_costtotal_cost_in_dollarsi.e.input_cost_in_dollars + output_cost_in_dollars
You can view the token costs for your model in the Bedrock pricing page. Since we're using Llama 3.1 8B Instruct in this tutorial, we set the token_input_cost and token_output_cost to the values for this model:
API response time
API responses can take a long time, especially for longer outputs, so it's useful to monitor this. To do this, we track the request start and end times and calculate the total time. Then, we include the response time in the event properties:
Errors
It's not uncommon for generative AI requests to fail and it's important to track these errors. To do this, we capture a bedrock_error event in the catch block of our code:
4. Create insights
Now that we're capturing events, we can create insights in PostHog to visualize our data. Below are five examples of useful metrics to track. Each of these starts by going to the Product analytics tab and clicking + New insight.
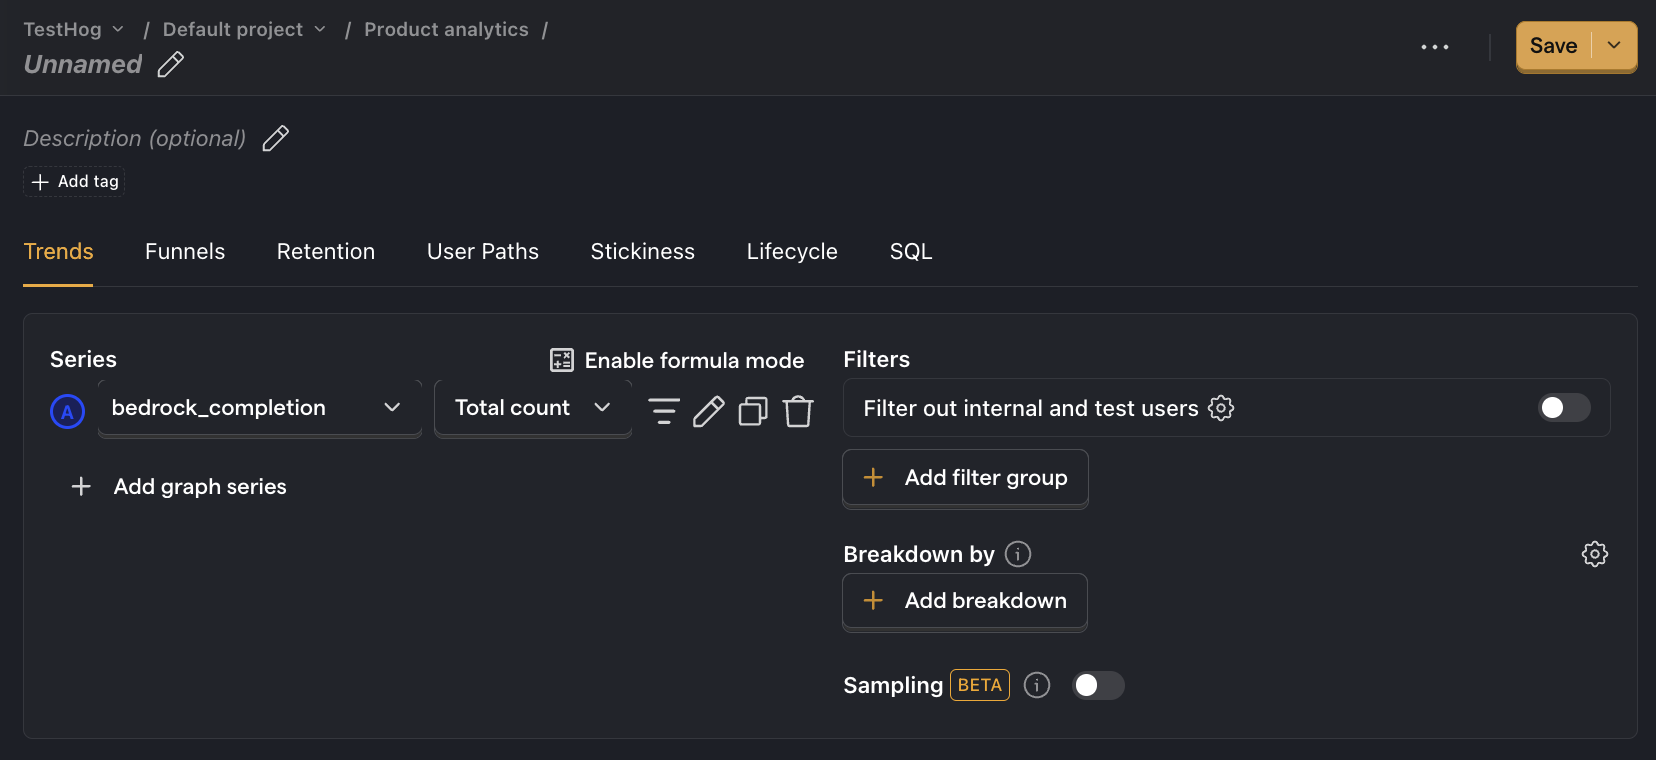
Generation count
What it is: The total number of successful requests to your model.
Why it's useful: Helps assess the workload and demand placed on your models, which directly impacts costs and performance.
How to set it up:
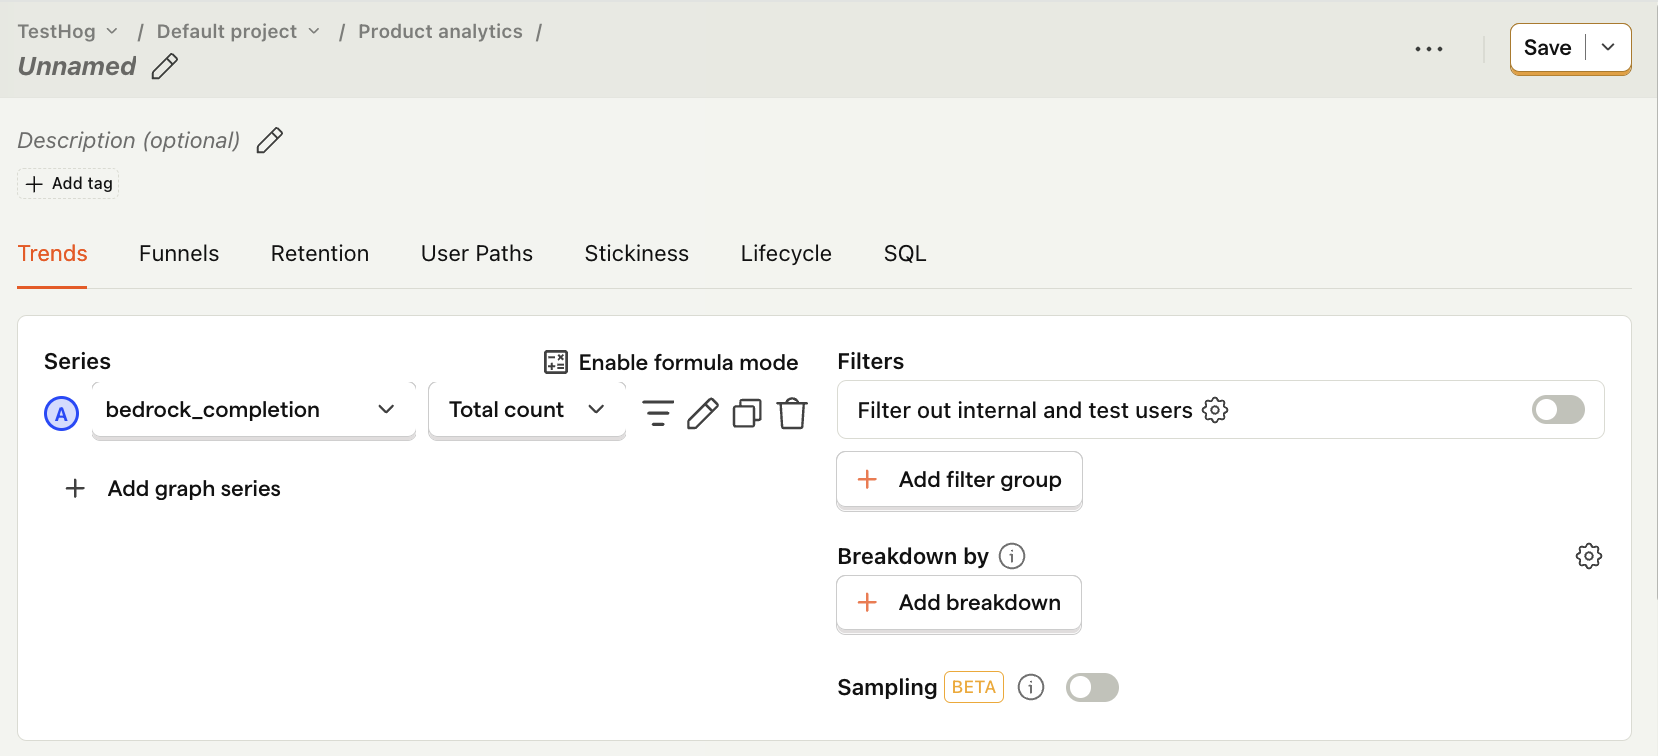
- Set the event to
bedrock_completion - Ensure the second dropdown shows Total count
- Press Save
Average cost per API call
What it is: How much each model evaluation costs on average.
Why it's useful: Gives you an idea of how much your costs will scale with usage.
How to set it up:
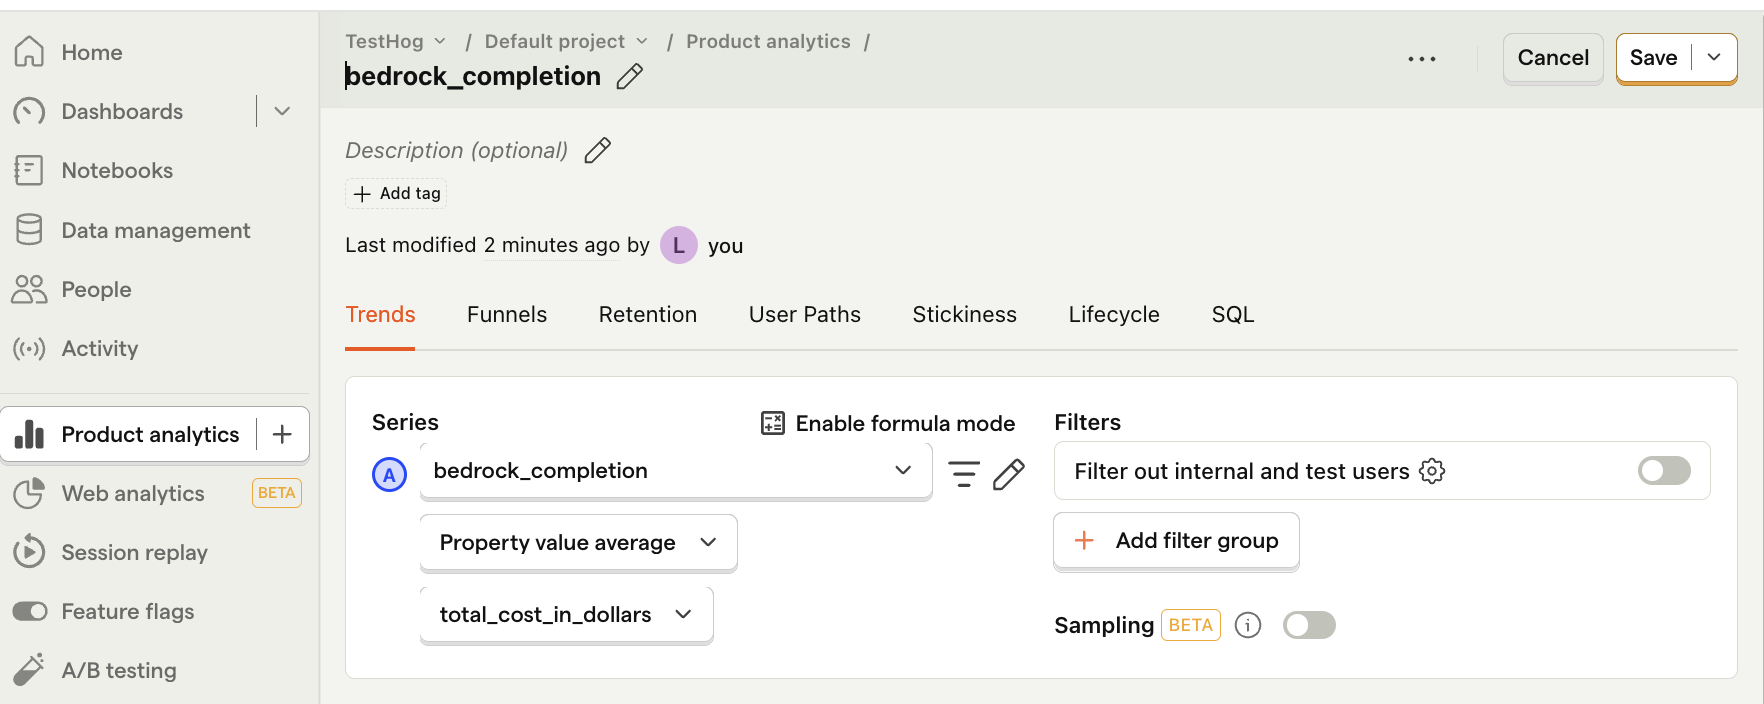
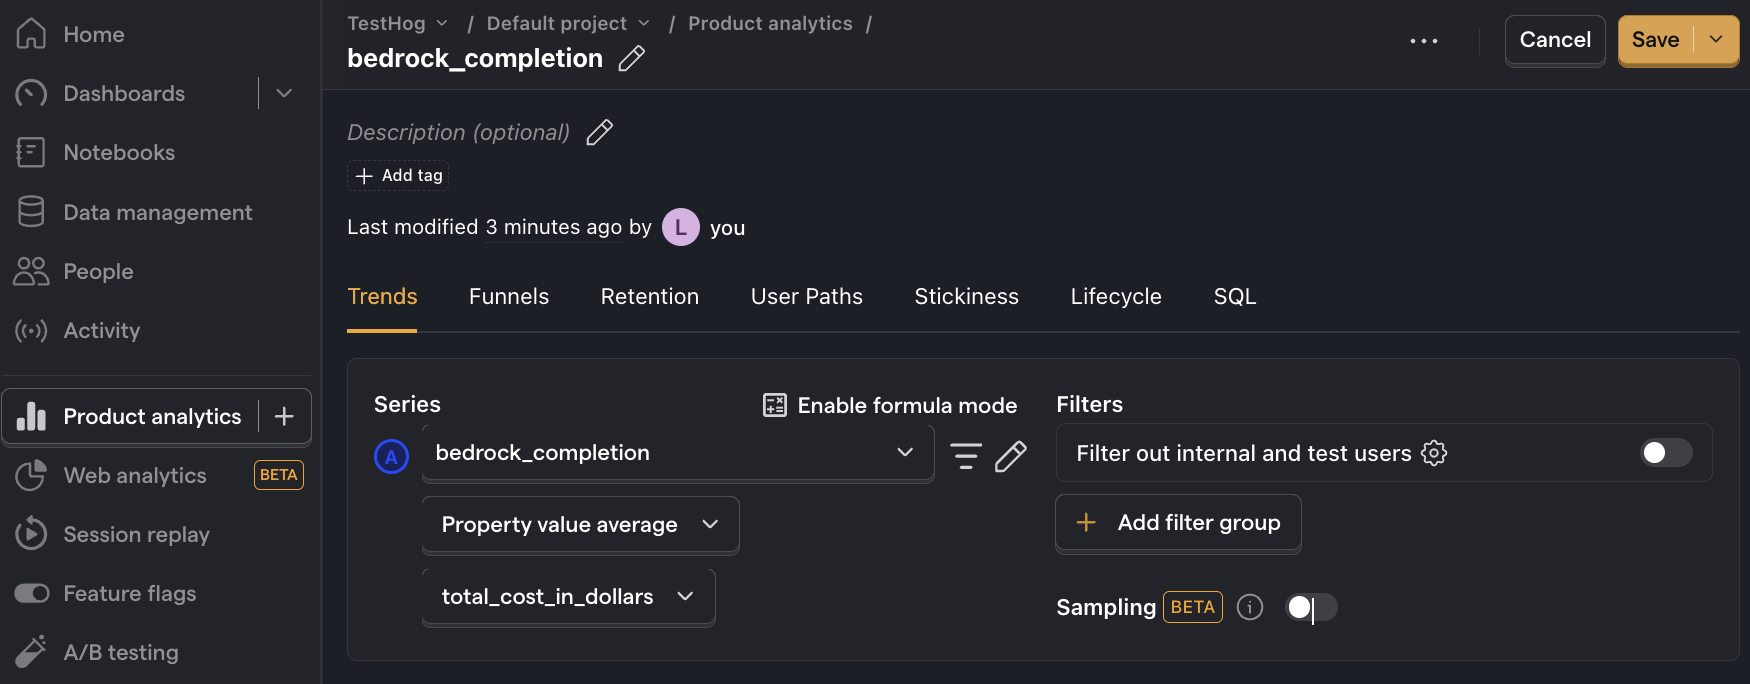
- Set the event to
bedrock_completion. - Click on Total count to show a dropdown. Click on Property value (average).
- Select the
total_cost_in_dollarsproperty.
Note: Insights may show 0 if the amount is less than 0.01. If this is the case, click on Enable formula mode and then type
A * 100in the formula box to multiply the value by 100. This shows you the average cost per 100 API calls.
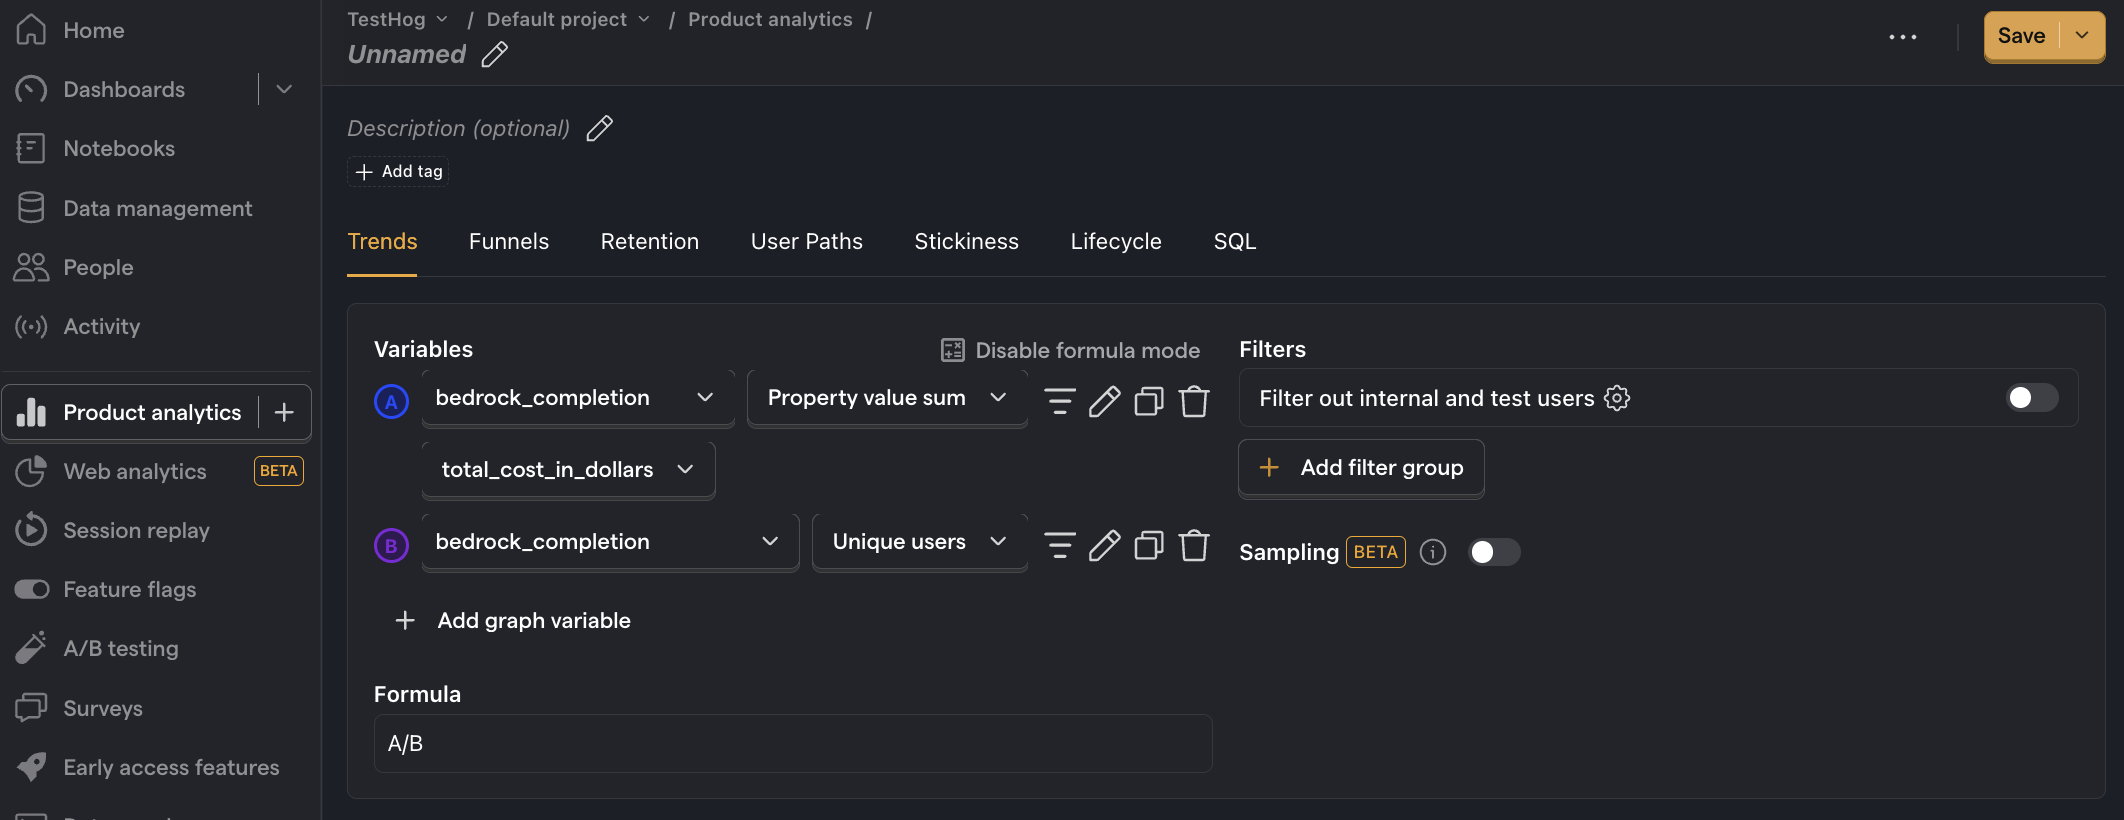
Average cost per user
What it is: Your total costs divided by the number of active users.
Why it's useful: Shows how your costs will grow with user growth. You can also compare this to revenue per user to understand if your profit margin is viable.
How to set it up:
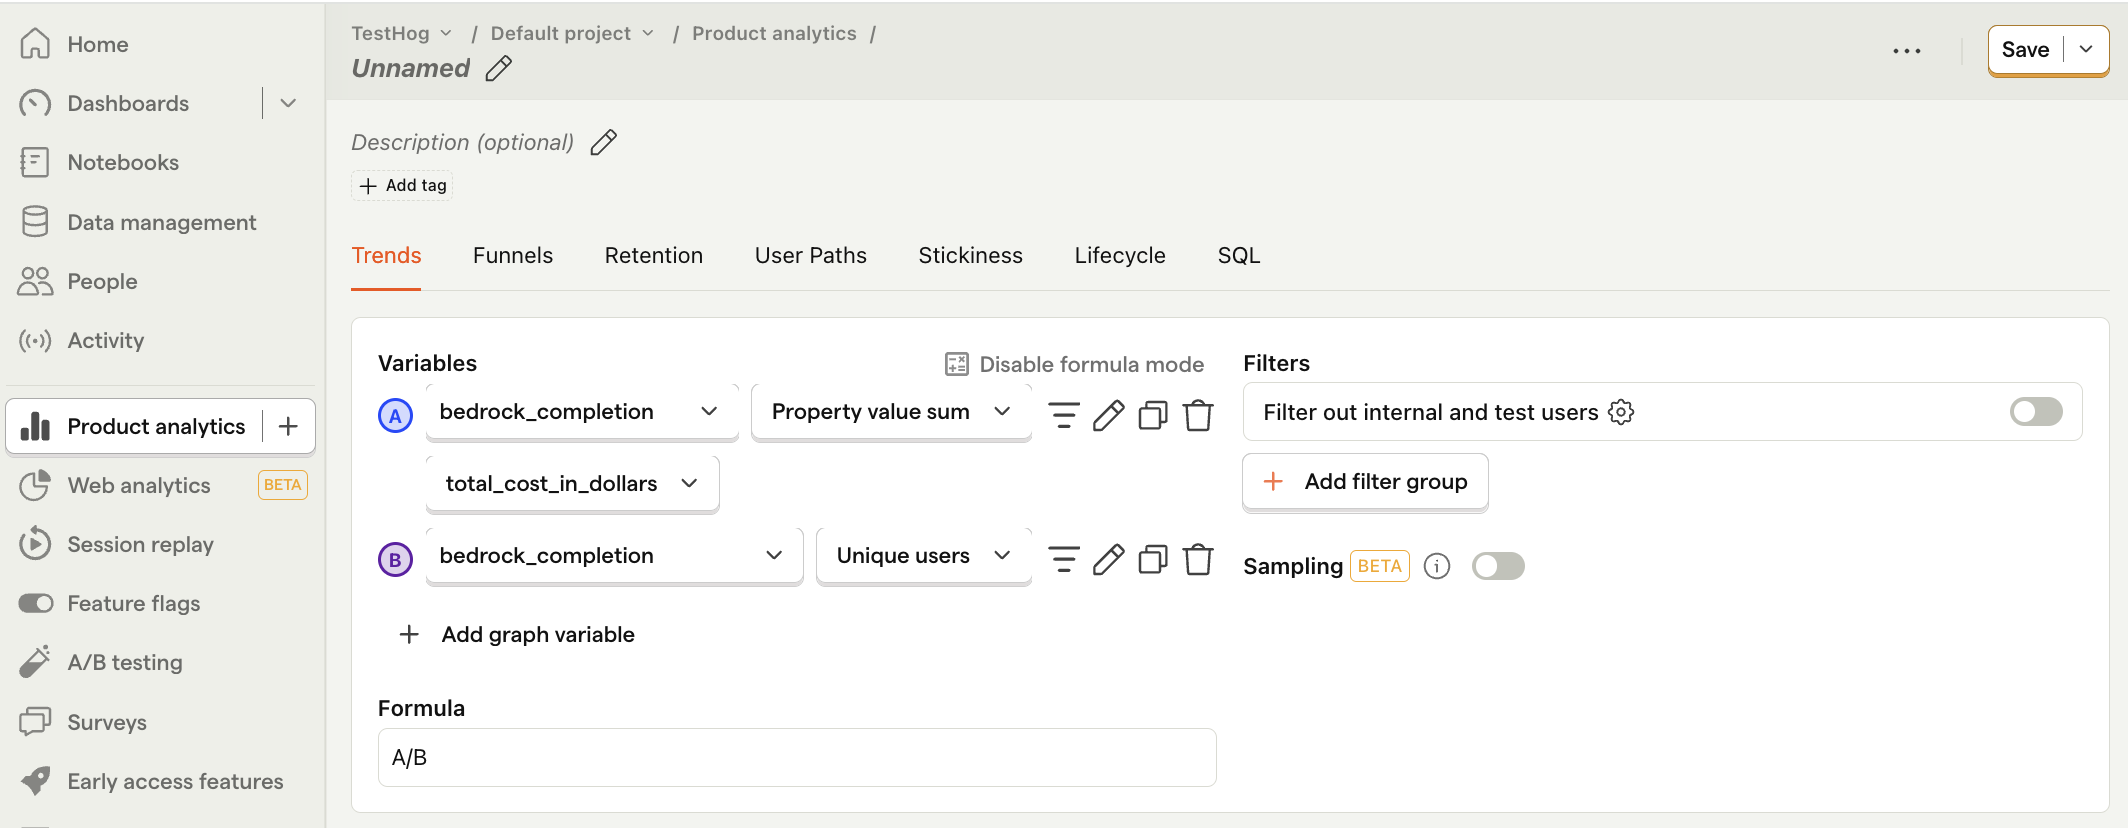
- Set the event to
bedrock_completion. - Click on Total count to show a dropdown. Click on Property value (sum).
- Select the
total_cost_in_dollarsproperty. - Click + Add graph series (if your visual is set to
number, switch it back totrendfirst). - Change the event name to
bedrock_completion. Then change the value from Total count to Unique users. - Click Enable formula mode.
- In the formula box, enter
A/B.
Note: Insights may show 0 if the amount is less than 0.01.
Average API response time
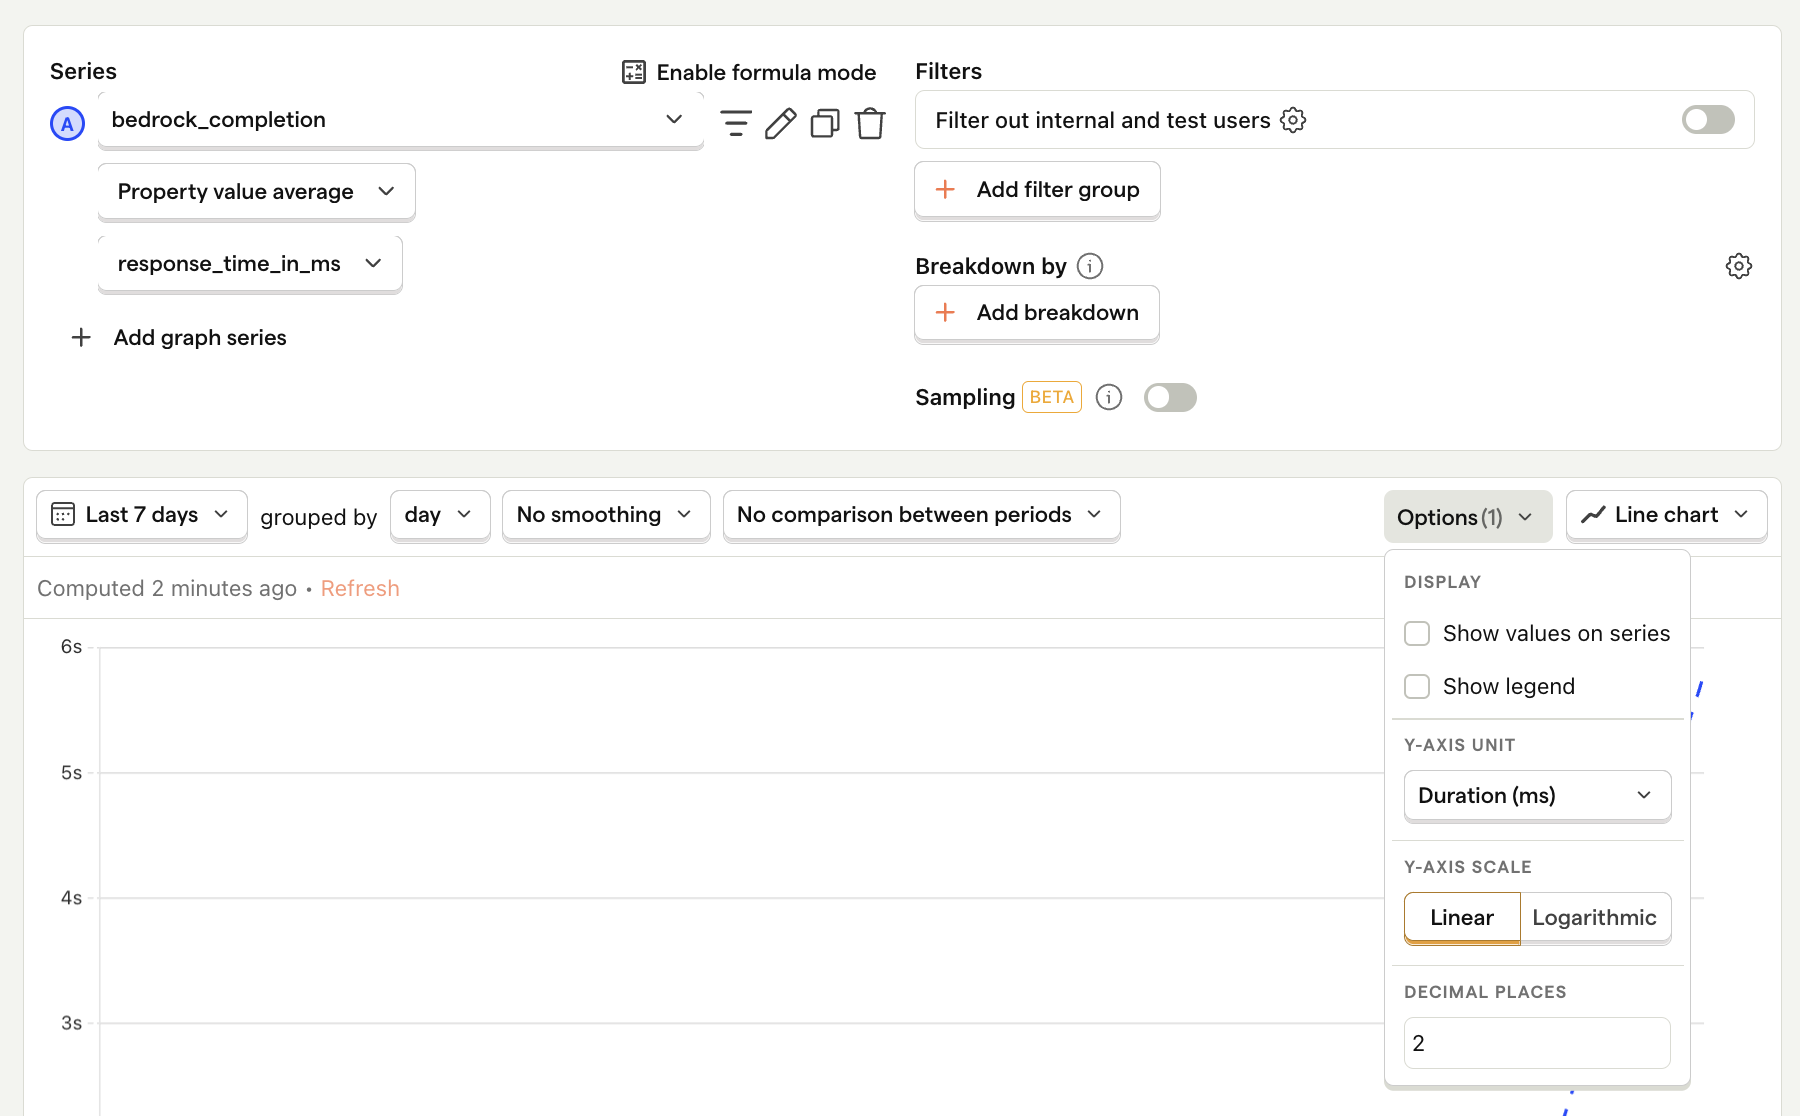
What it is: The average time it takes for the model to generate a response.
Why it's useful: Helps identify performance bottlenecks and ensures your UX meets user expectations for speed.
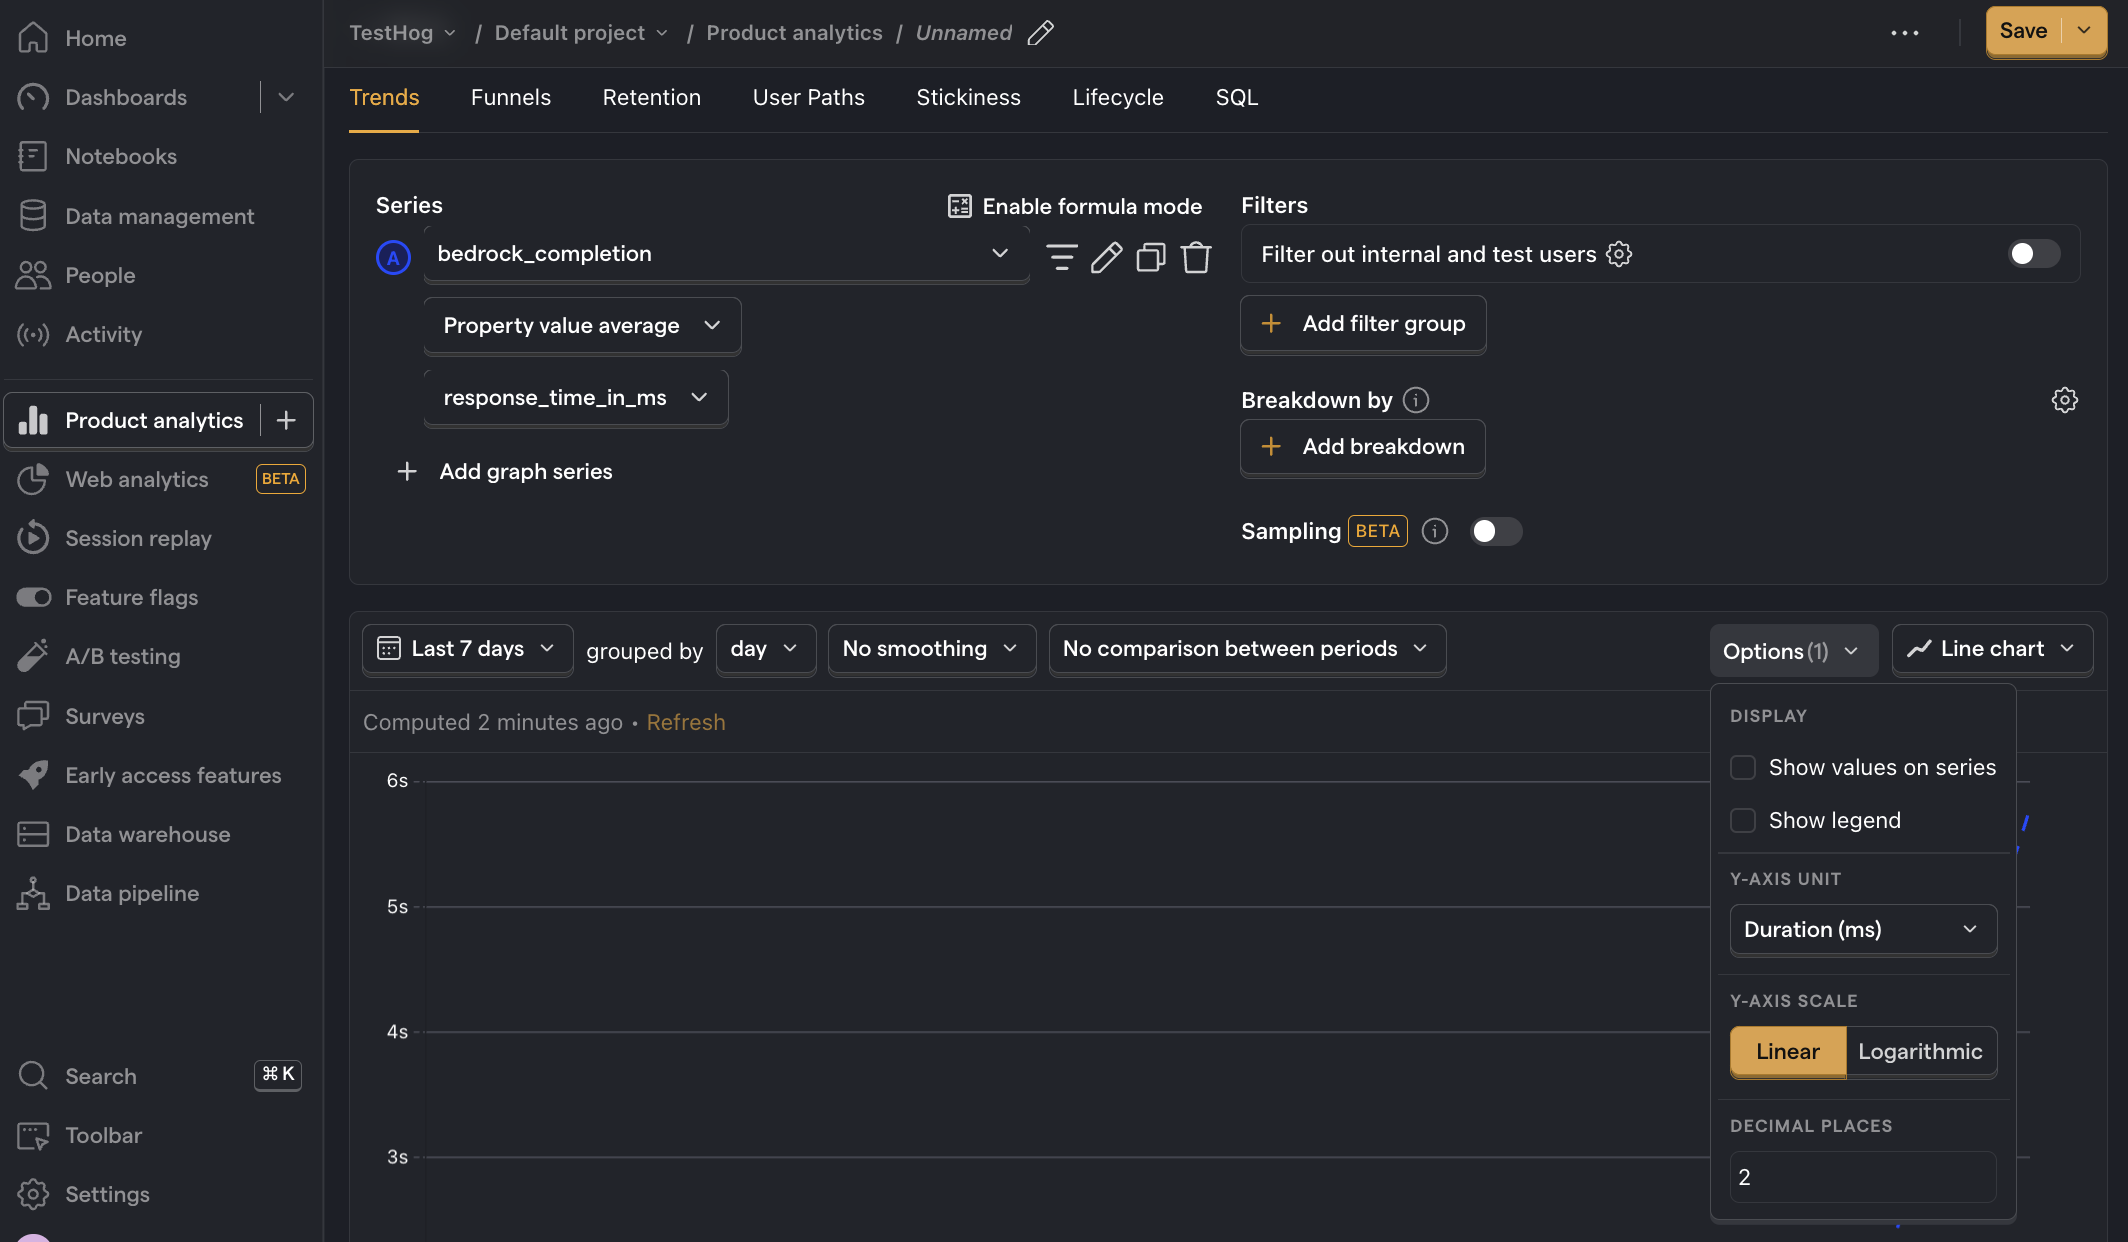
How to set it up:
- Set the event to
bedrock_completion - Click on Total count to show a dropdown. Click on Property value (average).
- Select the
response_time_in_msproperty. - For nice formatting, press Options and under
Y-axis unitselect Duration (ms)
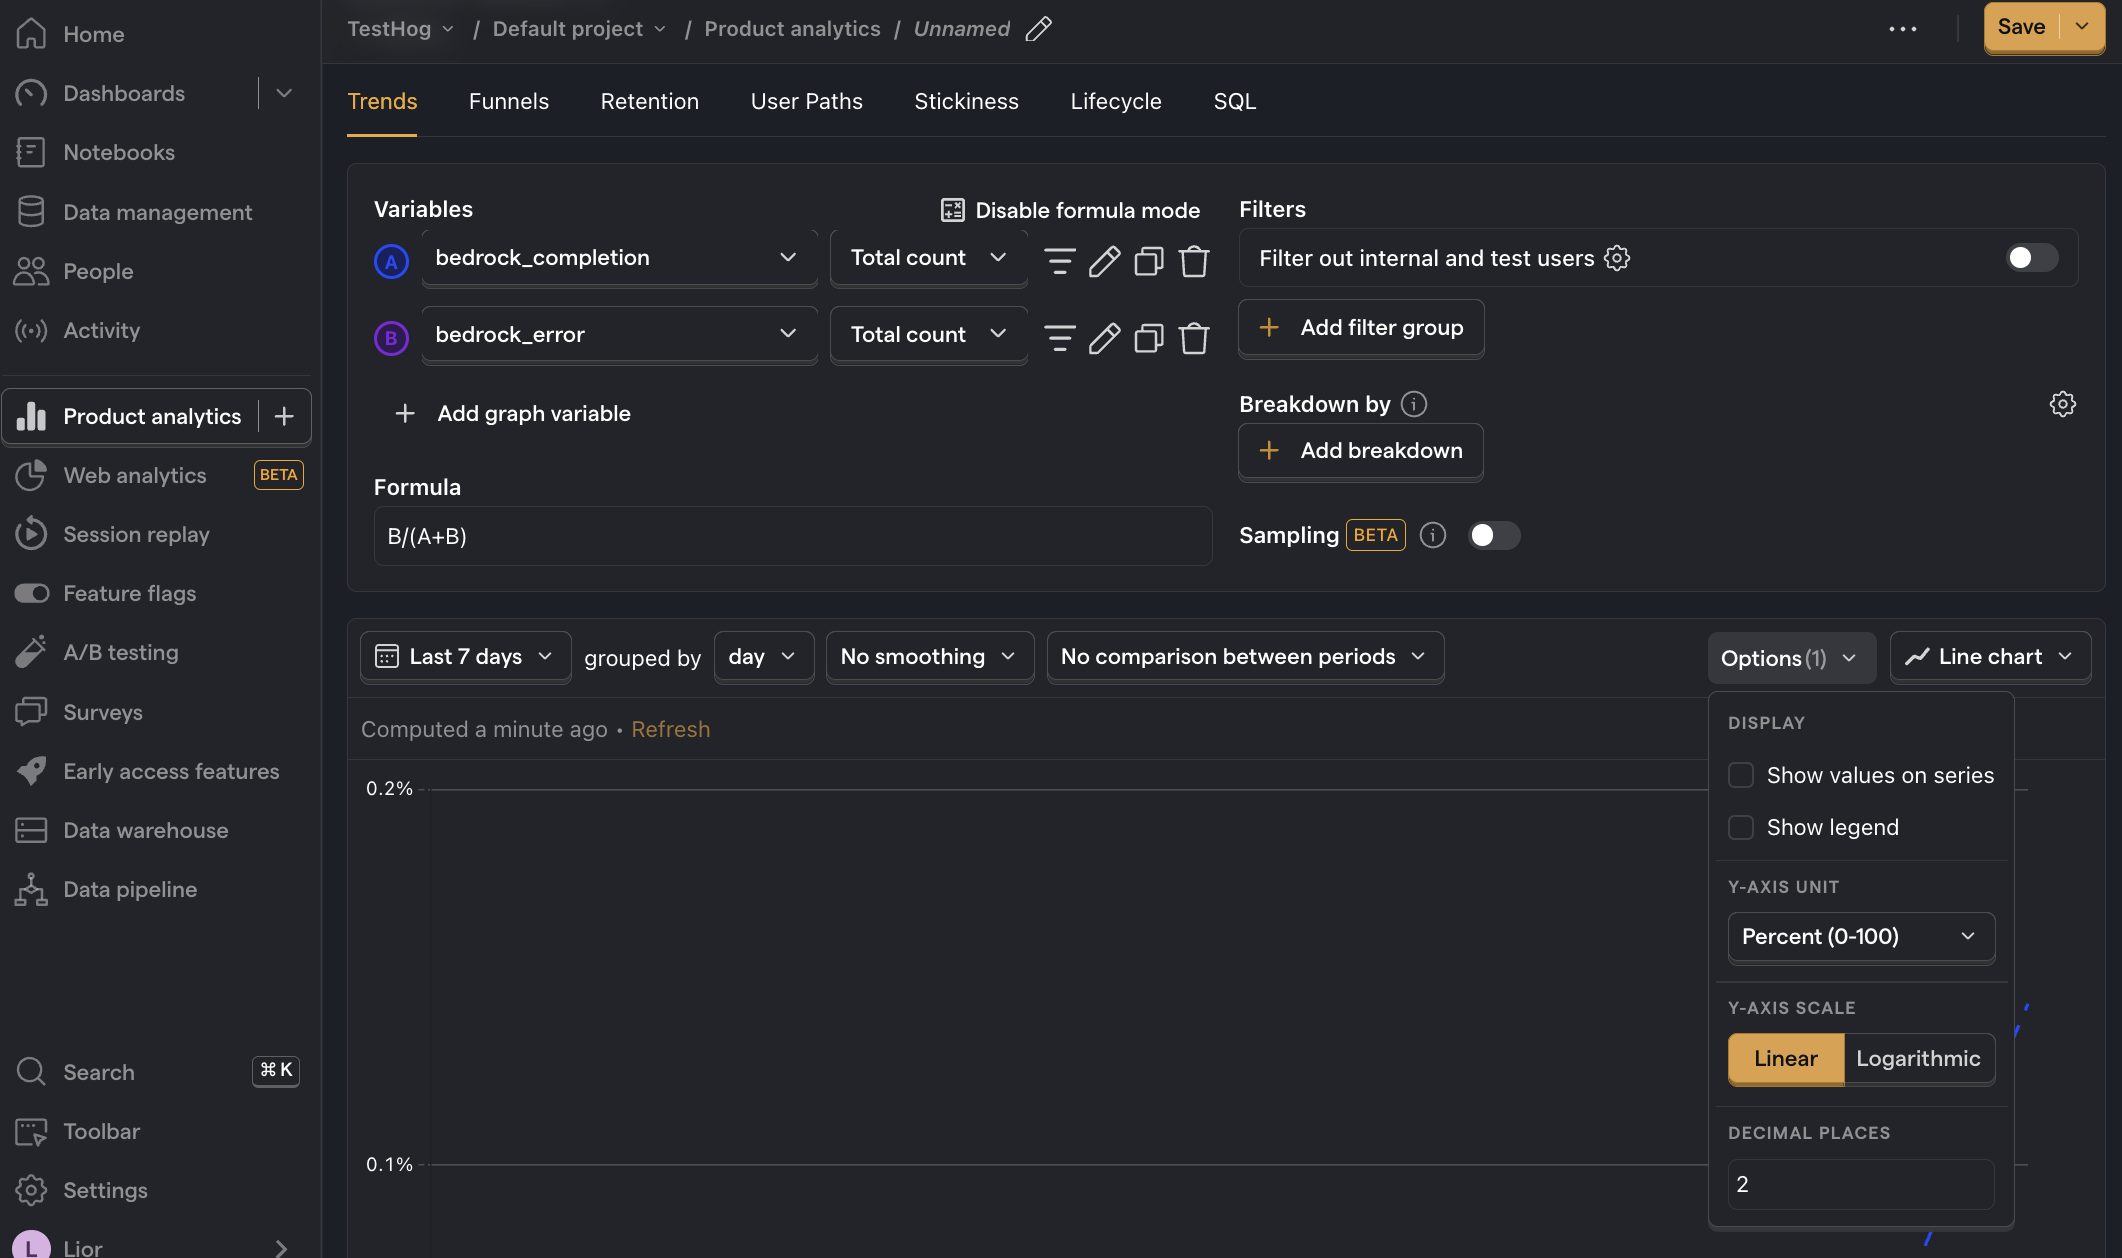
Error rate
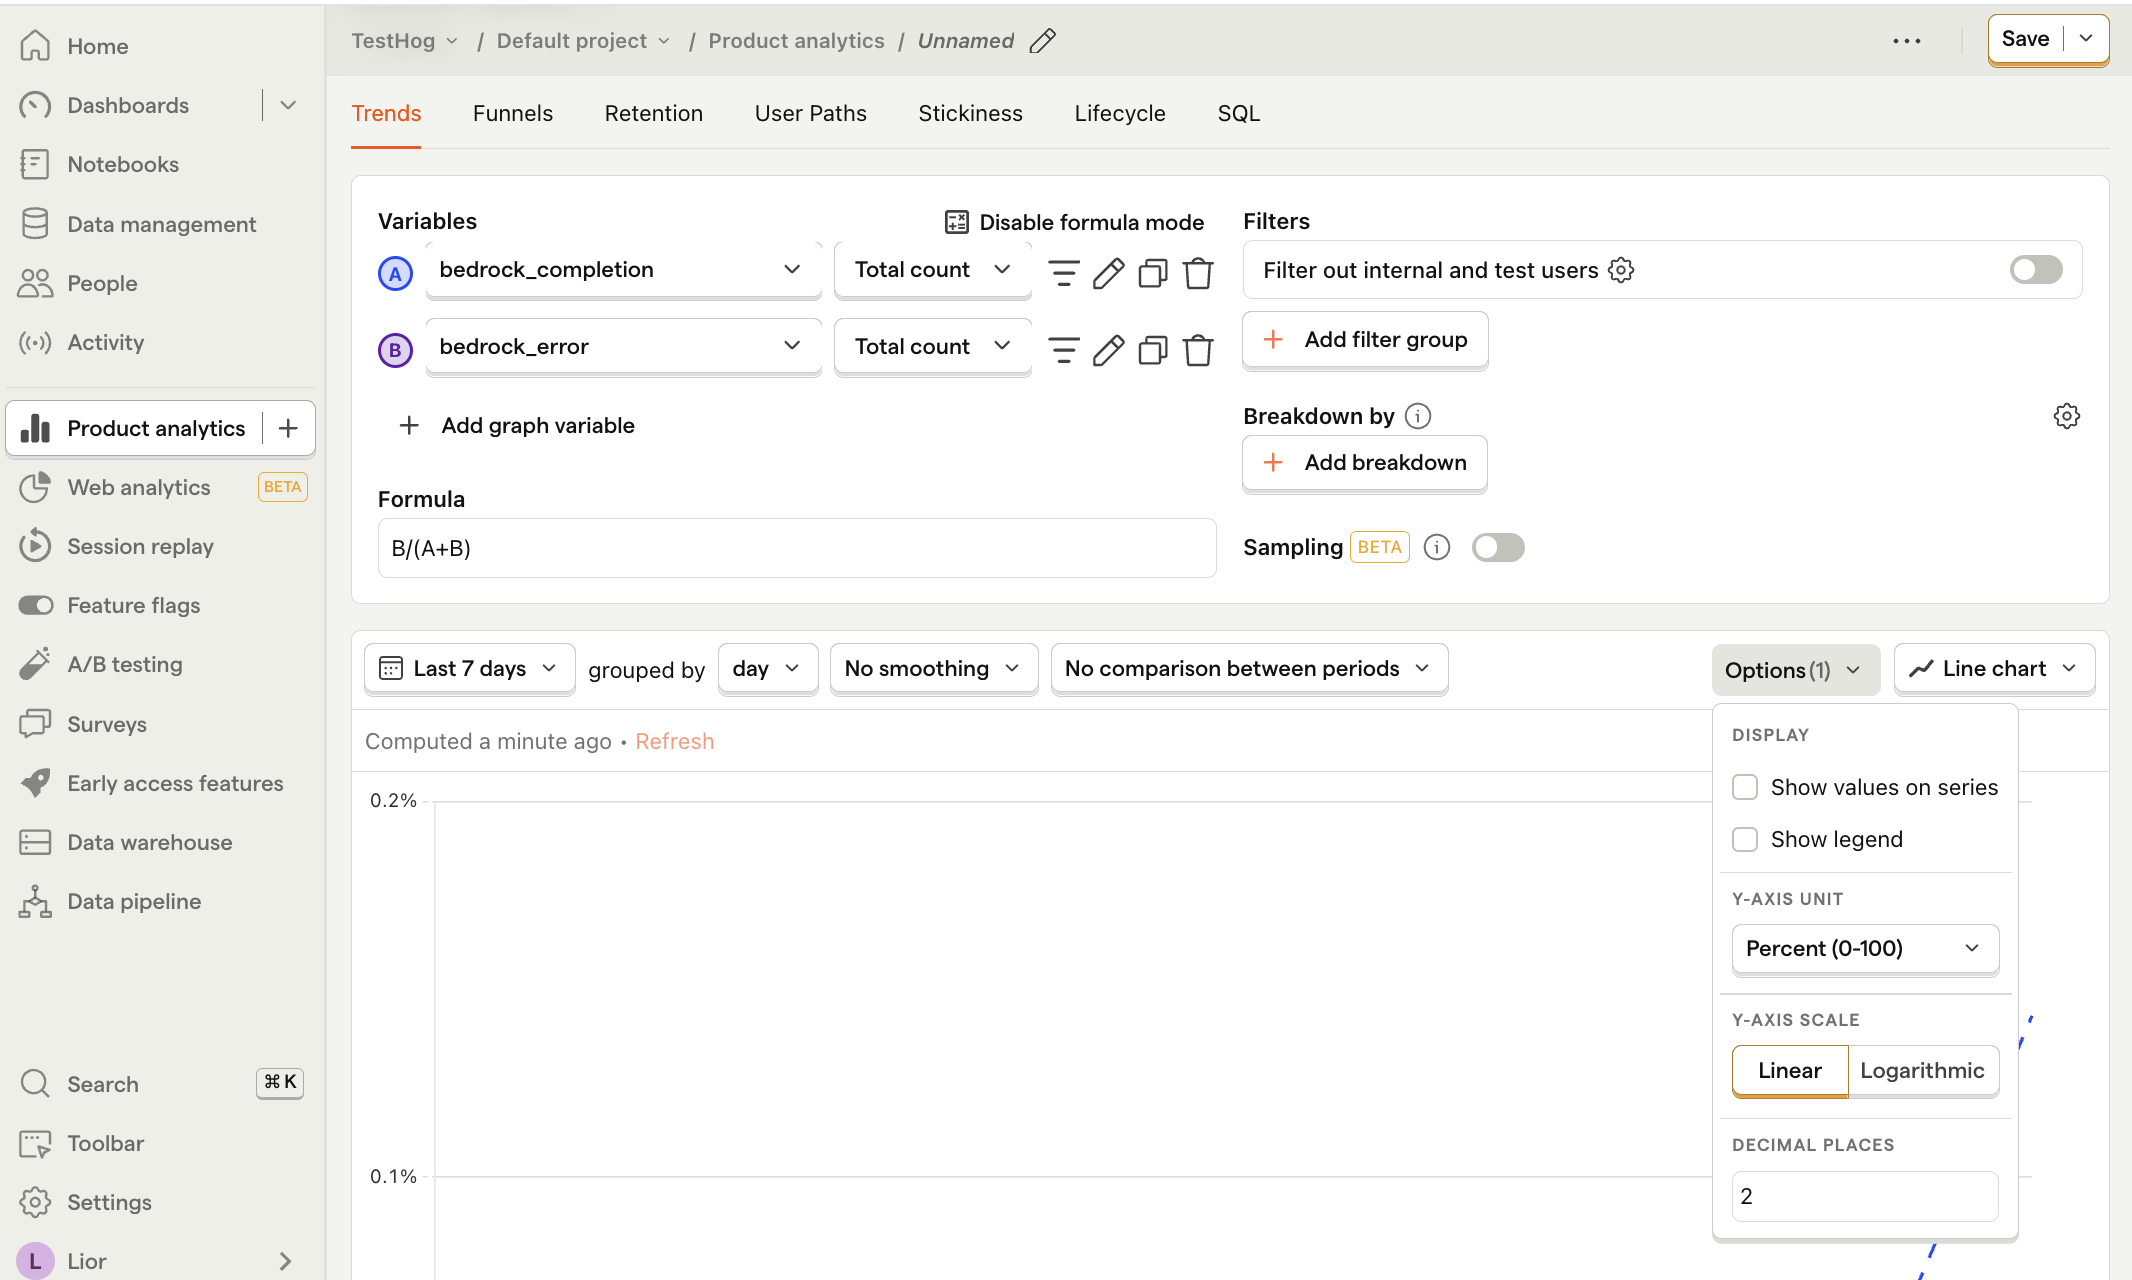
What it is: The percentage of API requests that result in an error.
Why it's useful: Enables you to pinpoint problematic generative AI requests and API calls.
How to set it up:
- Set the event to
bedrock_completion. Ensure it's set to Total count - Click + Add graph series (if your visual is set to
number, switch it back totrendfirst). - Change the event name to
bedrock_error. Ensure it's set to Total count . - Click Enable formula mode.
- In the formula box, enter
B/(A+B)i.e. the number of errors divided by the total number of requests. - For nice formatting, press Options and under
Y-axis unitselect Percent (0-100)
Further reading
- How to compare AWS Bedrock prompts
- How to set up LLM analytics for ChatGPT
- How to compare AWS Bedrock foundational models
